Suppose we want to graph the following function.
How can we approach this?
Vertical Asymptotes
The first step is finding the asymptotes. For the vertical asymptote, we want to find what makes the denominator equal to zero. The function is already in a simple form (otherwise we’d need to simplify it first (why? because the factors that cancel with the numerator will be holes in the graph rather than asymptotes)). We can then just solve,
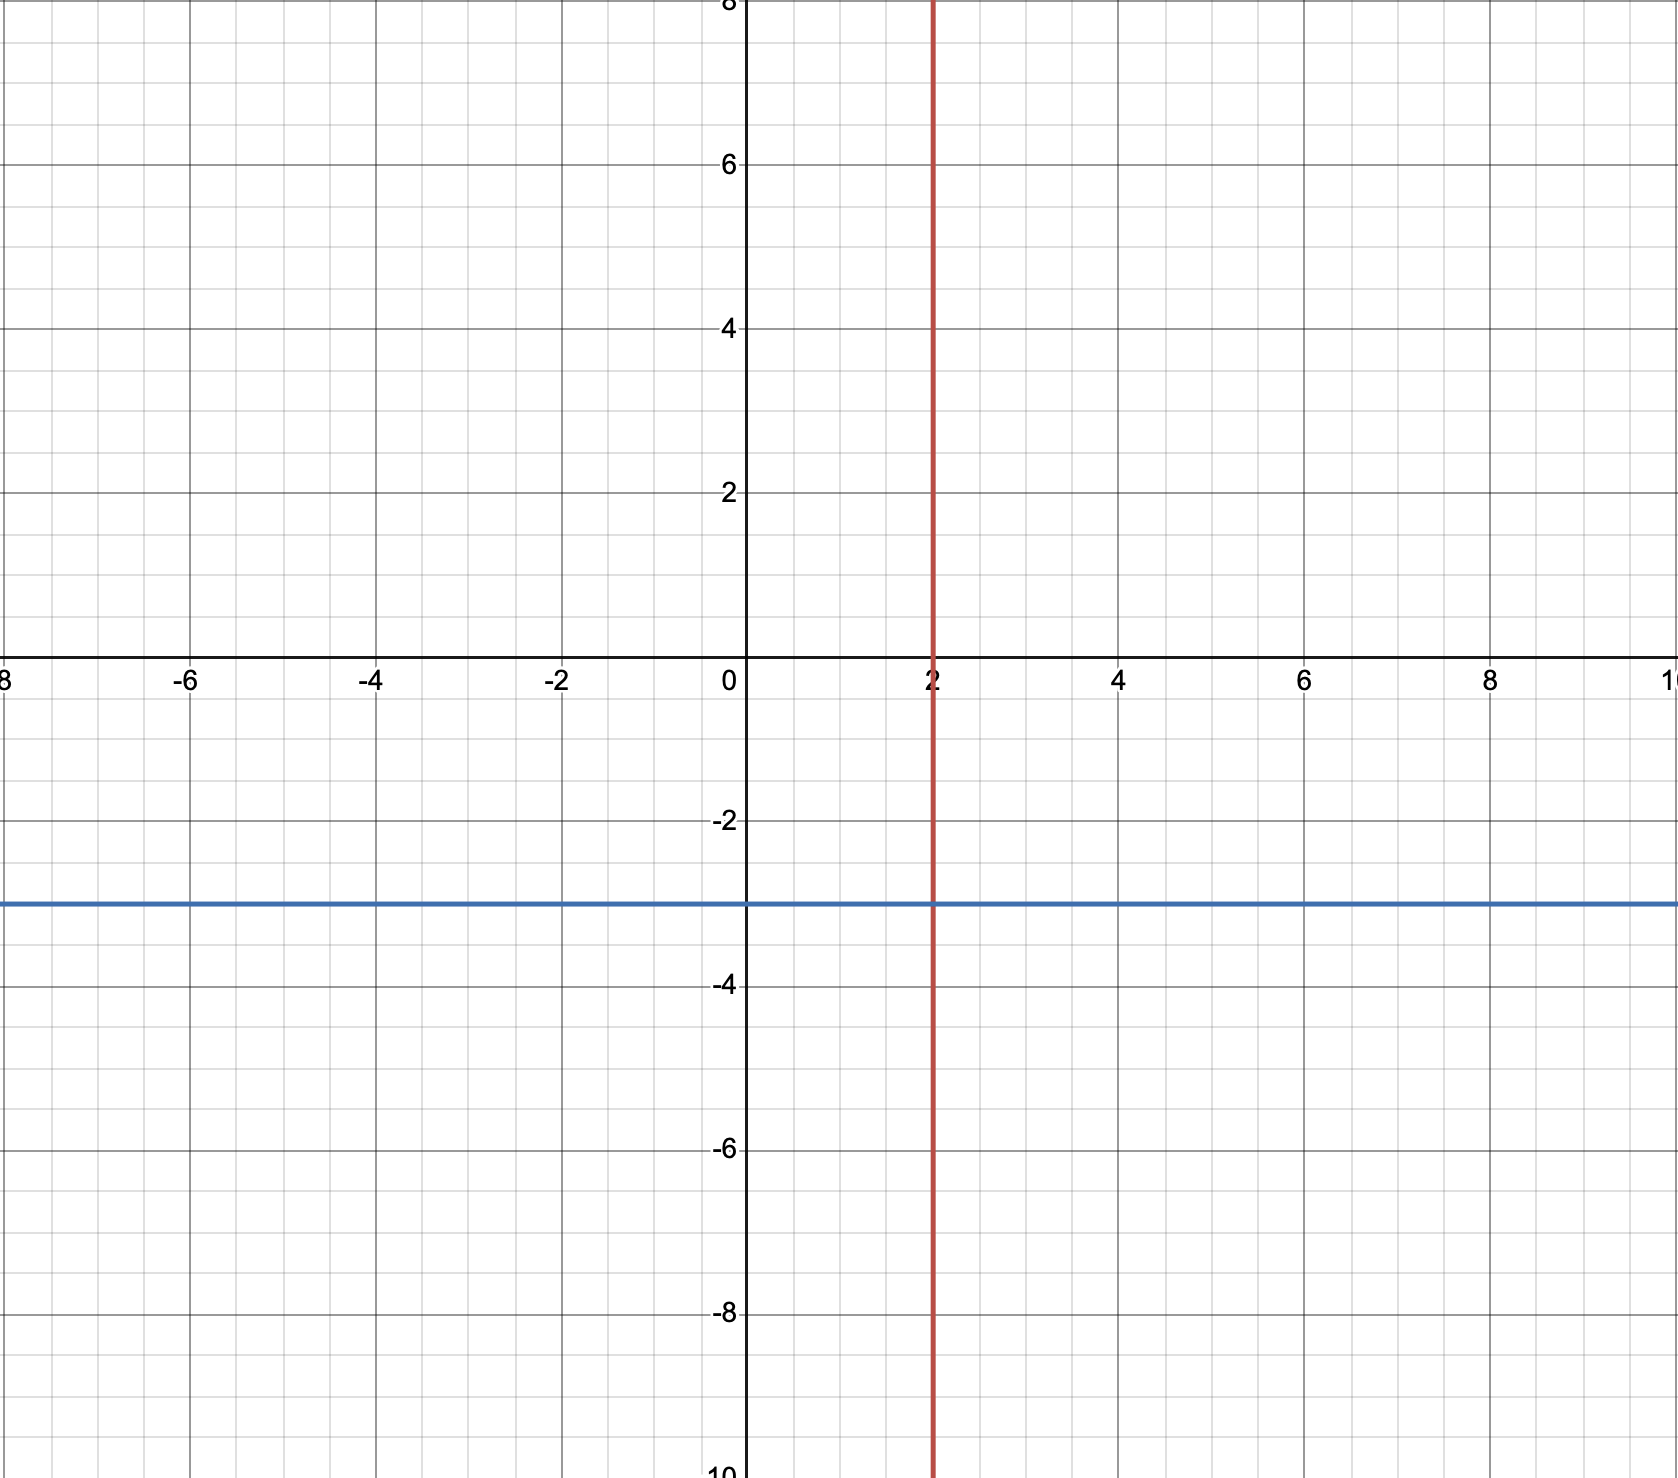
So \(x = 2\) will be our vertical asymptote.
Horizontal Asymptotes
Next, we need to find the horizontal asymptote. Let’s revise the three cases we did before. Suppose we have the function
Then,
- if \(m < n\), then the horizontal asymptote is \(y = 0\).
- if \(m = n\), then the asymptote is the leading coefficient of the numerator over the leading the coefficient of the denominator. \(\frac{a_m}{a_n}\).
- if \(m = n + 1\), we will have a slanted asymptote.
Here, \(m = n\), therefore, the horizontal asymptote is \(y = -3\).
Plotting points for each section of the graph
After graphing the asymptotes, we’ll have the following graph,
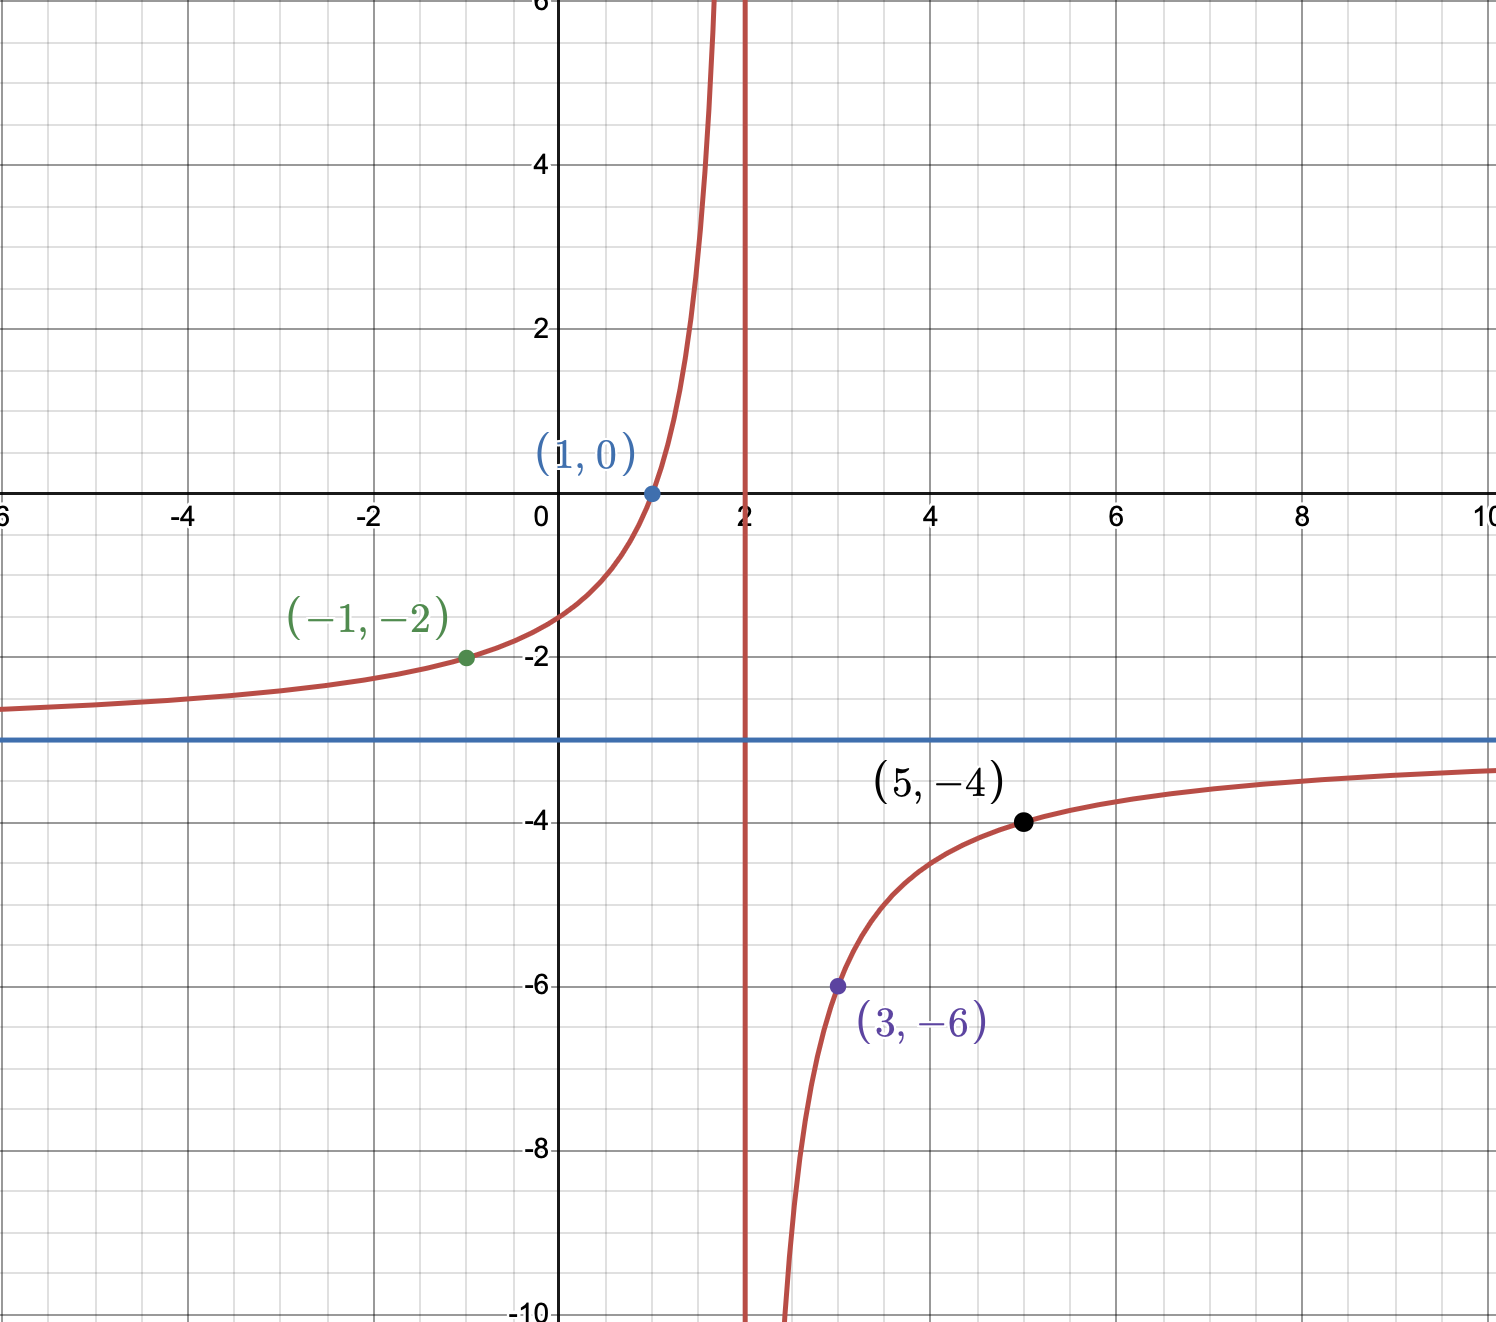
Now, we want to find at least two points to plot for each section of the graph. Let’s find the value of \(f\) for example at at 1 and -1. We can see that \(f(1) = \frac{3 - 3}{-1 + 2} = 0\) and \(f(-1) = \frac{-3 - 3}{-(-1) + 2} = -2\). For the other side, let’s find \(f\) at values \(3\) and \(5\). \(f(3) = \frac{9 - 3}{-1} = -6\) and \(f(5) = \frac{15 - 3}{-3} = -4\). And now we’re done!
References: